Official Guide · v4.3

How to use every corner of Mango

A complete guide, module by module. 38 tools distributed in 8 categories — from the screener to the commodities desk, including AI, agents, and portfolio.

38
Modules covered
8
Categories
10
Asset classes
EN · ES
Bilingual
Your first day

Quick start

If you only have 10 minutes, do this. The following steps will make you productive from your first login.

Step 01
Build your first watchlist

Search for 5-10 tickers that interest you and add them. Customize columns with metrics you care about.

Step 02
Run a screener

Stack 3-5 filters (e.g., market cap > $1B, FCF Yield > 5%, ROIC > 15%). Save the strategy.

Step 03
Ask Mango AI

Ask for the bull/bear thesis of your best candidate. Verify citations, adjust your view.

Fundamental research

Research & Fundamentals

Everything you need to go from a universe of 60,000 tickers to an actionable shortlist with defensible theses.

Stock Screener

/dashboard/screener

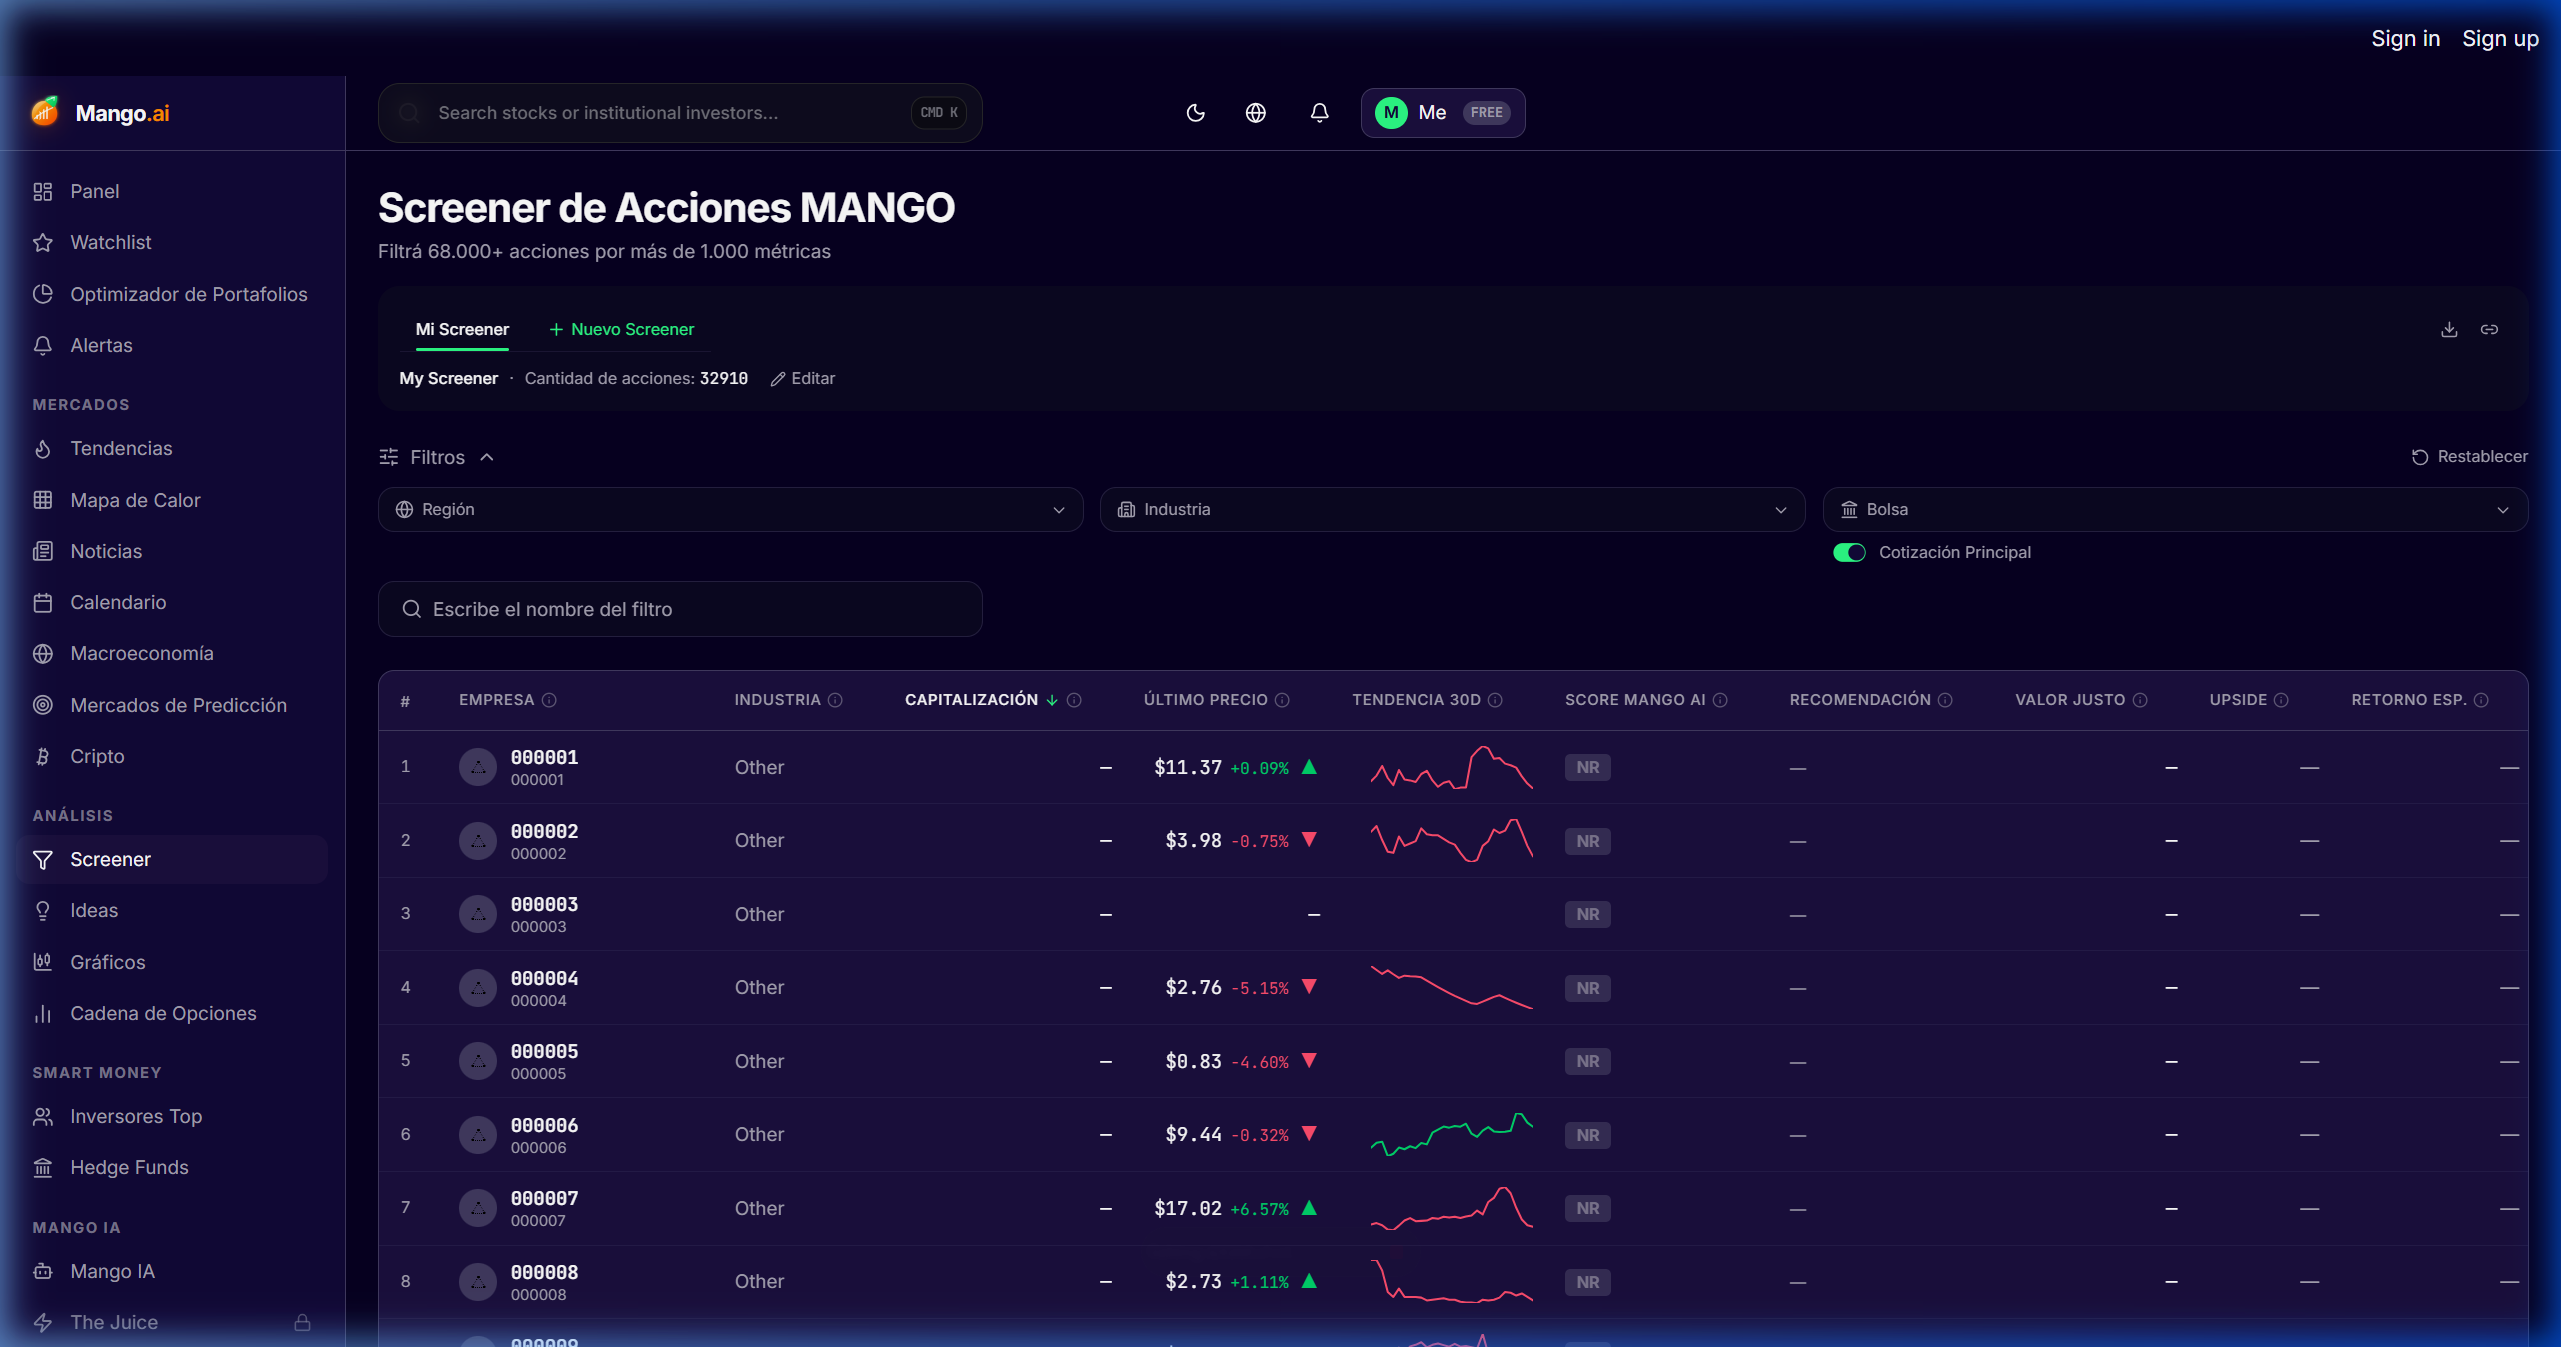
Filter the global universe by stacking over 1,000 fundamental, growth, valuation, and forward-estimate metrics in a single query. Save your strategies and reuse them with a click.

Cómo se usa
  • 1Open the Screener and choose the universe (US, global, sector, or base ETF).
  • 2Stack filters: Market Cap, EV/EBITDA, FCF Yield, Revenue CAGR, ROIC, Net Debt/EBITDA.
  • 3Refine by forward estimates (forward P/E, expected growth, revisions).
  • 4Save the combination as a strategy, export it to CSV, or pin it to your watchlist.
Stock Screener

Stock Detail Page (Deep Dive)

/dashboard/stock/AAPL

The institutional-grade file for any ticker: Financial Snapshot and Price Dynamic at the top for immediate read, followed by the Mango Quant Radar.

Cómo se usa
  • 1Search for a ticker from the top bar or enter from the screener.
  • 2Navigate the tabs: Overview, Financials, Estimates, Valuation, Ownership, Dividends, Filings, Earnings, KPIs, Forecast, Mango Rating, IR.
  • 3Use "Estimates → Revisions" to detect recent consensus changes.
  • 4Activate an alert or add to watchlist directly from the ticker header.
Stock Detail Page (Deep Dive)

Mango Rating

/dashboard/stock/AAPL/mango-rating

A proprietary score combining quality, valuation, momentum, ownership, and forensics for each stock — with a fully auditable breakdown.

Cómo se usa
  • 1Enter any stock → "Mango Rating" tab.
  • 2Review the 5 sub-scores and the rationale behind each one.
  • 3Compare against peers in the same sector to contextualize.
Mango Rating

Earnings Calendar

/dashboard/calendar

Earnings calendar with beat/miss history, consensus revisions, expected IV crush, and post-earnings drift.

Cómo se usa
  • 1Filter by week, sector, or your watchlist.
  • 2Click on a ticker to open its surprise history and expected curve.
  • 3Activate pre-earnings alerts from the row button.
Earnings Calendar

Forensics

/dashboard/forensics

Early detector of accounting risk: Beneish M-Score, Altman Z-Score, accrual ratios, and red flags in revenue recognition.

Cómo se usa
  • 1Open Forensics and filter by sector or active flags.
  • 2Inspect the breakdown: each metric has its definition and typical thresholds.
  • 3Cross-check with the stock's Mango Rating tab to confirm the verdict.
Forensics

News

/dashboard/news

Headlines tagged by ticker from over 200 sources, with AI summaries and sentiment score.

Cómo se usa
  • 1Filter by tickers in your watchlist, sector, or free search.
  • 2Read the AI summary before opening the note; save time in the daily feed.
  • 3Mark favorite sources to prioritize them in the feed ranking.
News

Ideas

/dashboard/ideas

Daily pool of curated ideas by theme, factor, and catalyst — from quality compounders to deep value or GARP.

Cómo se usa
  • 1Navigate the sidebar categories (quality, value, momentum, thematic).
  • 2Open the idea → thesis, comparables, risks, and expected catalyst.
  • 3Clone the idea to your watchlist or as a starting point for your own thesis.
Ideas
Markets and trading

Markets & Trading

Professional charts, heatmaps, options, volatility surface, and macro — for timing and context.

Pro Charting

/dashboard/charting

TradingView-level charts with technical indicators, drawings, multi-symbol comparison, and persistent layouts.

Cómo se usa
  • 1Load a ticker and choose the timeframe (intraday, daily, weekly).
  • 2Add indicators (RSI, MACD, VWAP, BBands, Ichimoku).
  • 3Compare up to 4 tickers on a single chart with normalized % axis.
  • 4Save the layout to reopen it in one click next session.
Pro Charting

Sector Heatmap

/dashboard/heatmap

Live S&P 500 / global map by capitalization, with drill-down by sector, factor, or intraday rotation.

Cómo se usa
  • 1Choose the universe (S&P 500, Nasdaq, Europe, EM).
  • 2Change "color by" between % change, momentum, valuation, or earnings surprise.
  • 3Drill-down by clicking a sector to see its constituents.
Sector Heatmap

Macroeconomics

/dashboard/macro

FRED and DBnomics dashboards: rates, inflation, liquidity, global growth — all at a glance.

Cómo se usa
  • 1Select a theme (rates, inflation, growth, liquidity).
  • 2Compare series using the overlay selector (e.g., PCE vs CPI core).
  • 3Mark series as favorites to appear on your home dashboard.
Macroeconomics

Options Chain

/dashboard/options

Full chain with Greeks, unusual flow, IV rank, and P/L visualizer for multi-leg strategies.

Cómo se usa
  • 1Load the ticker and choose the expiration date.
  • 2Filter by IV rank, volume vs OI, or target Greek.
  • 3Build a strategy (vertical, iron condor, butterfly) in the builder and review the P/L over the spot.
Options Chain

Volatility Surface

/dashboard/surface

3D volatility surface with skew, term structure, and IV cones — detect mispricings instantly.

Cómo se usa
  • 1Select the ticker; the surface loads skew vs term structure.
  • 2Compare against the historical cone to identify high/low IV.
  • 3Click on a point on the grid to open the chain at that strike/exp.
Volatility Surface
NEW · Commodities Intelligence

Commodities Suite

Seven hedge-fund level dashboards: Cross-asset Nexus, AI Strategist, and dedicated desks for energy, precious, industrial, agricultural, and softs — with curves, COT, inventories, and macro overlays.

Commodity Nexus

New
/dashboard/commodities/dashboards/overview

The cross-asset commodities command center: sector heatmap, top movers (gainers/losers/YTD), correlation matrix, and macro overlays (DXY, 10y TIPS, VIX, China PMI).

Cómo se usa
  • 1Filter by sector (energy, precious, industrial, agri, softs) or view "all".
  • 2Read the macro ribbon above to understand the background regime.
  • 3Cross-check the correlation matrix to detect natural pair trades.
  • 4Click on any commodity to open its sector dashboard.
Commodity Nexus

AI Strategist

AI
/dashboard/commodities/dashboards/strategist

Mango AI builds long/short commodity pair trades anchored in macro, curves, and COT positioning — with thesis, rationale, and invalidation level.

Cómo se usa
  • 1Launch the Strategist without parameters to propose the setup of the day.
  • 2Or set a macro thesis (e.g., "long energy / short rates") and let it iterate.
  • 3Each idea brings rationale, suggested exposure, and conceptual stop.
AI Strategist

Energy Desk

/dashboard/commodities/dashboards/energy

WTI, Brent, natural gas, gasoline, and heating oil — curves, EIA inventories, crack spreads, and COT positioning.

Cómo se usa
  • 1Compare WTI vs Brent (Atlantic spread).
  • 2Look at the curve: contango vs backwardation defines the regime.
  • 3Cross-check with DXY and real rates for entry timing.
Energy Desk

Precious Metals

/dashboard/commodities/dashboards/precious-metals

Gold, silver, platinum, and palladium with real rate overlays (10y TIPS), DXY, and central bank demand.

Cómo se usa
  • 1Look at the gold/silver ratio to detect excesses.
  • 2Cross gold vs real rates — the inverse correlation is the key signal.
  • 3Review physical ETF flows (GLD, SLV) as confirmation.
Precious Metals

Industrial Metals

/dashboard/commodities/dashboards/industrial-metals

Copper, aluminum, zinc, nickel, and lithium — LME inventories vs China PMI in a single view, with term structure and COT.

Cómo se usa
  • 1Look at China PMI + LME inventories → real demand vs sentiment.
  • 2Use the copper/gold ratio as a proxy for global growth.
  • 3Cross-check with the materials sector of the Heatmap to confirm.
Industrial Metals

Agricultural

/dashboard/commodities/dashboards/agricultural

Corn, wheat, soybeans, soyoil, and meal — USDA WASDE, weather risk, exports, and positioning.

Cómo se usa
  • 1Review upcoming WASDE reports on the integrated calendar.
  • 2Cross-check your thesis with the weather module (droughts, frosts, ENSO).
  • 3Compare COT vs price to detect positioning exhaustion.
Agricultural

Softs

/dashboard/commodities/dashboards/softs

Coffee (Arabica & Robusta), sugar, cocoa, cotton, and orange juice — supply-shock tracker with ENSO overlays.

Cómo se usa
  • 1Look at the Arabica vs Robusta spread to detect weather premium.
  • 2Cross cocoa with Côte d'Ivoire and Ghana output.
  • 3Use El Niño / La Niña flags as an overlay on the curve.
Softs
Crypto Suite

Crypto Suite

Six dedicated dashboards: Cross-chain Nexus, spot & derivatives, multi-asset, on-chain intelligence, token fundamentals, and news.

Crypto Nexus

/dashboard/cripto/dashboards/nexus

Cross-chain command center: BTC dominance, ETH gas, stablecoins, total cap rotation, and sector heatmap.

Cómo se usa
  • 1Look at BTC dominance + stablecoin supply → risk-on/risk-off regime.
  • 2Use the sector heatmap (L1, L2, DeFi, AI, RWA) to detect rotation.
  • 3Cross-check with the Multi-Asset module for correlation with TradFi.
Crypto Nexus

Spot & Derivatives

/dashboard/cripto/dashboards/spot

Live spot prices + funding rates, basis, and open interest on CEX and DEX. Detect extremes before the squeeze.

Cómo se usa
  • 1Filter by exchange or aggregate top 5 for a robust signal.
  • 2Extreme funding + growing OI = liquidation risk.
  • 3Compare basis vs spot to understand the implied carry.
Spot & Derivatives

Multi-Asset View

/dashboard/cripto/dashboards/multi-asset

Side-by-side risk and correlation: BTC vs S&P, ETH vs QQQ, gold vs BTC. To understand what regime you are in.

Cómo se usa
  • 1Choose the correlation window (30d, 90d, 1y).
  • 2Look at beta and rolling correlation — regimes change fast.
  • 3Use the view to decide if BTC is moving like "tech" or like "gold".
Multi-Asset View

Crypto Intelligence

/dashboard/cripto/dashboards/intelligence

On-chain whale moves, exchange flows, miner reserves, hash rate, and aggregate sentiment.

Cómo se usa
  • 1Review the whale transactions feed for movements > $1M.
  • 2Net inflow to exchanges = sell risk; outflow = accumulation.
  • 3Cross miner reserves vs hash rate for BTC macro timing.
Crypto Intelligence

Token Fundamentals

/dashboard/cripto/dashboards/fundamentals

Active addresses, TVL, fees, revenue, and P/S ratios for tokens with real metrics (not memecoins).

Cómo se usa
  • 1Filter by sector (DEX, lending, perp, L2, infra).
  • 2Order by forward P/S or QoQ fee growth.
  • 3Read the fundamental rationale before acting — not just the price.
Token Fundamentals

Crypto News

/dashboard/cripto/dashboards/news

Curated crypto news by token, chain, and narrative — with AI summaries and automatic thematic tagging.

Cómo se usa
  • 1Filter by narrative (AI, RWA, DePIN, L2, restaking).
  • 2Mark favorite tokens to prioritize them in the feed.
Crypto News
AI and intelligence

AI & Intelligence

Your team of AI analysts: a research assistant with verifiable citations, an MCP agent lab, and two curated intelligence feeds.

Mango AI

/dashboard/ai

A 24/7 quantitative analyst anchored in live data. Every claim links to a 10-K, transcript, fundamental data point, or price — no hallucinations.

Cómo se usa
  • 1Start with a broad question ("NVDA bull/bear thesis in 2026") or a surgical one ("NVDA FCF margin last 8 quarters").
  • 2Each citation is clickable: takes you to the exact source.
  • 3Use the prompt templates: thesis, comparables, risks, scenario analysis.
Mango AI

Agent Lab (MCP)

Beta
/dashboard/mcp-finance

Workspace to build and launch AI agents with MCP that execute multi-step workflows: screener → research → comparables → report.

Cómo se usa
  • 1Choose a template (earnings recap, sector deep dive, peers comp).
  • 2Connect MCP tools (Tiingo, SEC, FRED, Polymarket, your own MCP).
  • 3Launch the agent and review the plan step-by-step before the deliverable.
Agent Lab (MCP)

The Juice (Intelligence)

/dashboard/intelligence

Curated daily intelligence: catalysts, smart-money moves, narrative shifts, and macro events in a single actionable feed.

Cómo se usa
  • 1Navigate the feed every morning before trading.
  • 2Filter by theme or relevance to your watchlist.
  • 3Each item links to the source module (Top Investors, Forensics, etc.).
The Juice (Intelligence)

Extreme Prediction Markets

New
/dashboard/prediction-markets

Institutional probabilistic intelligence terminal. Aggregates Polymarket, Kalshi, and PredictIt in real time (60s refresh) and cross-checks them against real assets (futures, rates, ETFs) to surface arbitrage and ready-to-execute hedges — with a dedicated AI analyst and a visual catalyst radar.

Cómo se usa
  • 1Scan the top signal strip to spot macro divergences, volatility spikes, and the day's alpha signals.
  • 2Filter by category (Economics, Crypto, Politics, Tech, Science) using the header pills — the feed re-ranks live.
  • 3Read the Catalyst Heat Radar to see where volume and volatility are concentrated by sector.
  • 4In the Arbitrage Divergence Engine, compare Implied (Polymarket) vs Asset Proxy (Wall St) and the Alpha column — divergence > 10% is an actionable signal.
  • 5Open "Deep Dive Analysis" on any market to inspect probability history, strategic catalysts, correlation risk, implied vol, and sentiment index.
  • 6Use the AI Hedging Analyst (right panel) with quick prompts ("Analyze Rates", "Crypto Hedges") or free-form natural-language queries — it returns concrete tickers (SPY, TLT, GLD, KRE puts).
  • 7Every market ships with a pre-built "Institutional Hedge" ready to send to Portfolio Optimizer or Watchlist.
Extreme Prediction Markets
Smart money

Smart Money & Quants

See what the best are doing: 13Fs from legends, positioning of 8,400+ hedge funds, and 20 ensemble-scored quant engines.

Top Investors

/dashboard/top-investors

13F portfolios of Buffett, Burry, Ackman, Klarman, and 50+ legendary investors — updated every quarter with deltas.

Cómo se usa
  • 1Navigate the ranking; click on a name for deep-dive.
  • 2Look at "New positions" and "Top adds/trims" for actionable tracking.
  • 3Cross-check with your screener — if Buffett buys, it's worth reviewing the rationale.
Top Investors

Hedge Funds

/dashboard/hedge-funds

8,400+ hedge fund portfolios with quarterly deltas, style classification, and performance metrics.

Cómo se usa
  • 1Filter by style (long/short, event-driven, quant, multi-strat).
  • 2Order by AUM, performance, or top-10 concentration.
  • 3Open a fund → view "Holdings", "Activity", "Style fingerprint".
Hedge Funds

Quant Matrix

/dashboard/quant-matrix

20 quantitative engines (CAN SLIM, F-Score, Wyckoff, Bull/Bear AI, dark pool proxy, momentum, etc.) ensemble-scored for high-conviction names.

Cómo se usa
  • 1Open the matrix; each engine issues PASS/FAIL.
  • 2Filter by "High Conviction" → top decile on each engine.
  • 3Click on an engine to understand what it measures and how it is calculated.
Quant Matrix
Portfolio and risk

Portfolio & Risk

Optimizer, backtesting, watchlists and alerts. The full execution loop, from idea to monitoring.

Portfolio Optimizer

/dashboard/portfolio

Mean-variance, maximum Sharpe, and risk-parity optimization on your real positions, with efficient frontier and suggested rebalancing.

Cómo se usa
  • 1Load your holdings manually or connect your broker.
  • 2Choose the objective (max Sharpe, min vol, risk parity, equal weight).
  • 3Visualize the efficient frontier and compare against your current portfolio.
  • 4Apply the suggested weights or use manual rebalancing with drift bands.
Portfolio Optimizer

Backtesting Hub

/dashboard/backtesting

Walk-forward backtests vectorbt-style on any saved screener or quant signal, with institutional metrics.

Cómo se usa
  • 1Choose the screener / signal to backtest.
  • 2Define window (in-sample / out-of-sample) and rebalancing frequency.
  • 3Read Sharpe, max drawdown, hit-rate, and equity curve.
  • 4Export results or save as internal benchmark.
Backtesting Hub

Watchlists

/dashboard/watchlist

Unlimited multi-asset watchlists with custom columns (any fundamental, technical, or quant metric) and inline alerts.

Cómo se usa
  • 1Create a watchlist by thesis, sector, or regime.
  • 2Configure custom columns: forward P/E, ROIC, 3M momentum, FCF yield.
  • 3Activate inline alerts from the row itself.
Watchlists

Alerts

/dashboard/alerts

Price, fundamental, insider, and news alerts delivered by desktop, push, or email — with webhooks to integrate them into your stack.

Cómo se usa
  • 1Create an alert from any ticker or from the Alerts page.
  • 2Choose the trigger (price, RSI, news sentiment, insider buy, EPS revision).
  • 3Define channel (desktop, email, push, webhook) and priority.
Alerts
Customization

Settings & Customization

Adapt Mango to your workflow: language, theme, account data, integrations, and shortcuts.

Settings

/dashboard/settings

Customization center: language (EN/ES), theme (light / dark / midnight OLED), currency preferences, alerts, and external connections.

Cómo se usa
  • 1Settings → Appearance: change theme and density.
  • 2Settings → Language: toggle EN ↔ ES without reloading.
  • 3Settings → Integrations: connect brokers, calendars, or webhooks.
Settings
Power user

Keyboard Shortcuts

Mango is designed so that you almost never touch the mouse. These are the shortcuts you will use most.

Open global search (tickers, modules, commands)CtrlK
Go to ScreenerGS
Go to Mango AIGA
Go to Commodity NexusGC
Go to Crypto NexusGX
Go to HeatmapGH
Go to Portfolio OptimizerGP
Go to Prediction Markets (Polymarket / Kalshi)GV
Show full contextual shortcut list?
Mini-glossary

Terms you will find

Short definitions of the jargon most used in the platform. For something deeper, ask Mango AI — it will always cite the source.

FCF Yield

Free Cash Flow / Market Cap. Measures how much cash the company generates per dollar of capitalization.

ROIC

Return on Invested Capital. Efficiency with which the company converts capital into profits.

Beneish M-Score

Model that estimates the probability of accounting manipulation. Used by Forensics.

Altman Z-Score

Probability of bankruptcy in a 2-year horizon. < 1.8 = distress zone.

COT

Commitment of Traders — net positioning of managed money in futures (commodities).

Contango / Backwardation

Shape of the futures curve: contango = upward curve; backwardation = downward curve.

NVT / MVRV

On-chain crypto valuation metrics based on volume and holders' cost basis.

IV Rank

Current percentile of implied volatility vs its annual range.

13F

Mandatory quarterly disclosure of holdings for funds > $100M in the US.

MCP

Model Context Protocol — Anthropic's standard for an LLM to use external tools (used by Agent Lab).

Implied Probability

Probability implied by a prediction market price (Polymarket/Kalshi). If "Yes" trades at $0.58, the market implies a ~58% chance.

Asset Proxy

Probability derived from a real asset (rate futures, options, ETFs) used as an institutional benchmark against the prediction market.

Divergence / Alpha

Difference between Implied (crowd) and Asset Proxy (Wall St). A divergence > 10% typically flags actionable arbitrage in the Arbitrage Divergence Engine.

Institutional Hedge

Cross-asset hedge strategy suggested by Mango (e.g., long SHY against rate cuts) — paired with every market in Prediction Markets.

Ready to start

You already know every tool. Now make your first screener.

The best way to learn Mango is by using it. Start with the module that caught your attention most in this guide and build your workflow from there.